Finance
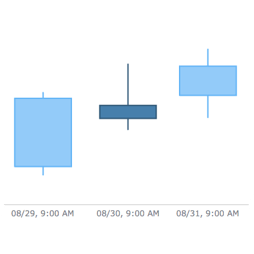
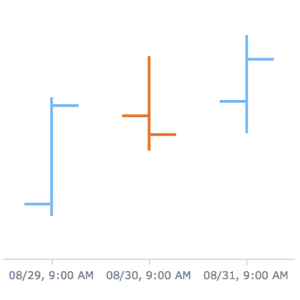
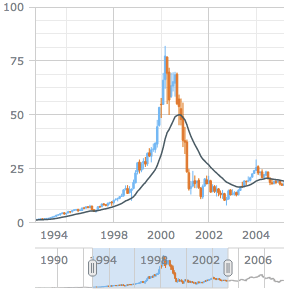
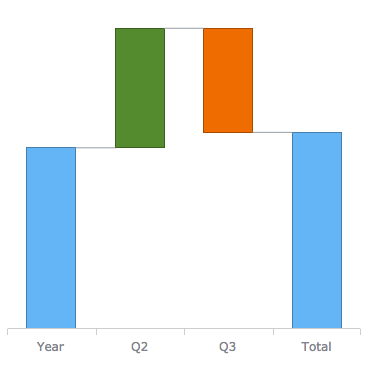
Data visualization in finance is a specific field of charting where candlestick, OHLC and stock chart types prevail.
The series here represents a financial parameter (e.g. price) that changes over time, so the X-axis is always a date/time scale.
Widely used by traders and investors, financial charts may feature technical indicators for easier market trend analysis and prediction.