Range
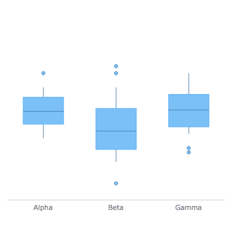
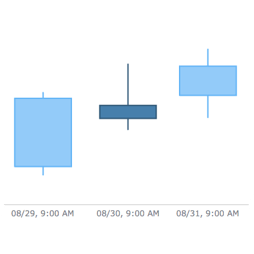
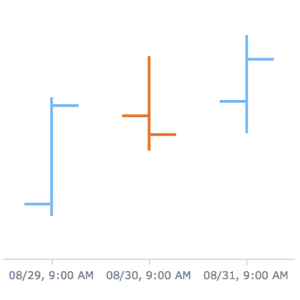
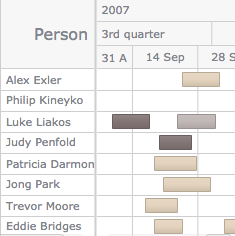
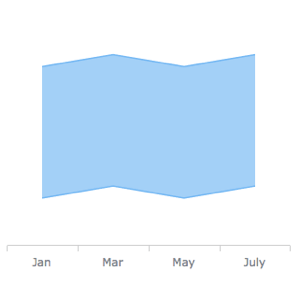
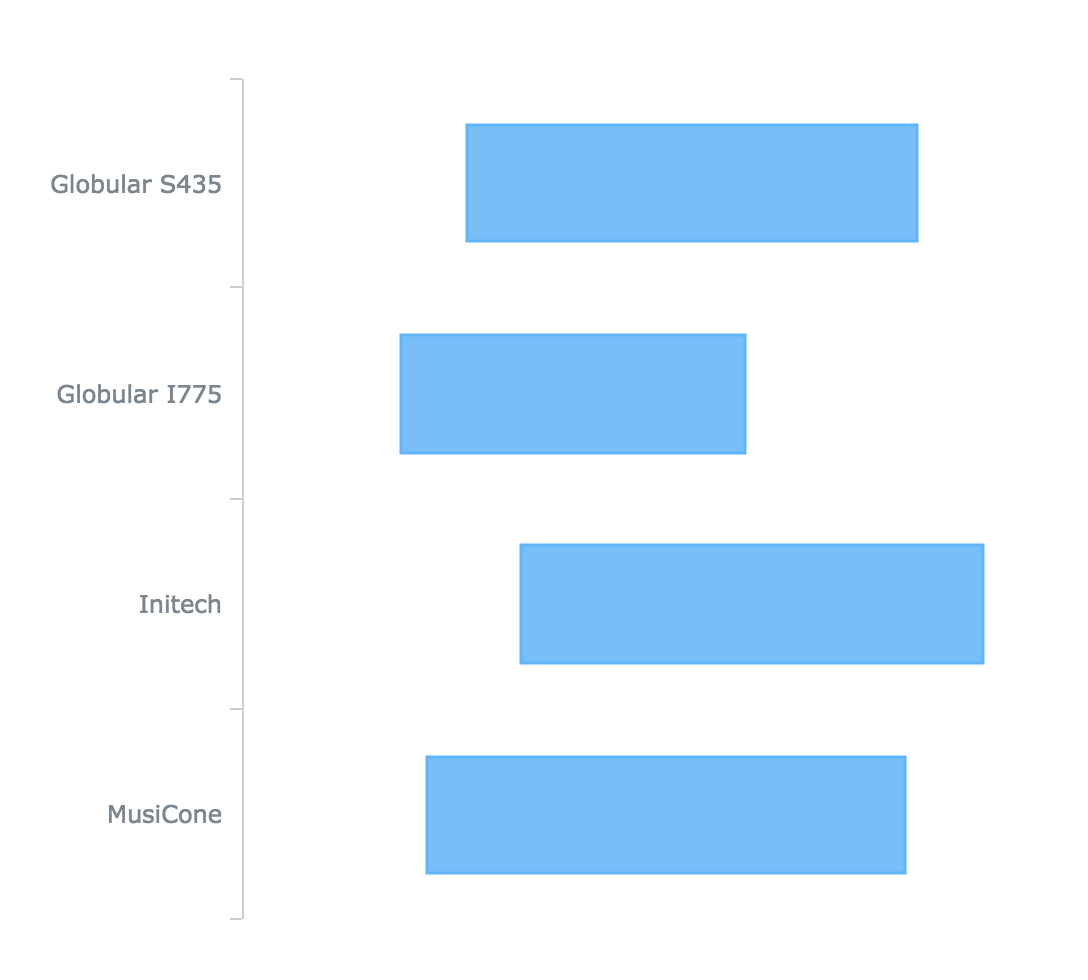
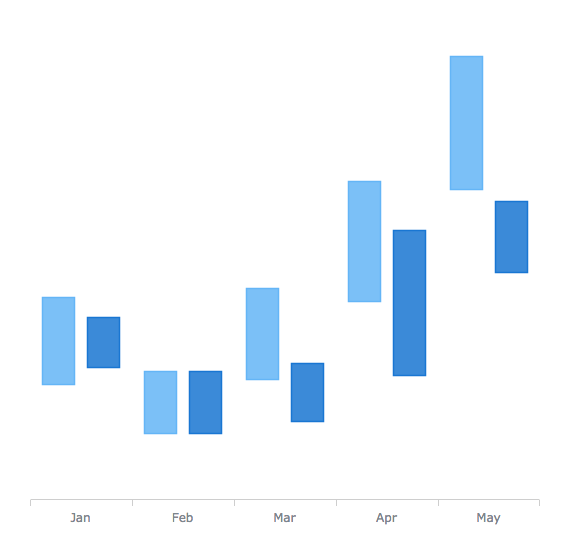
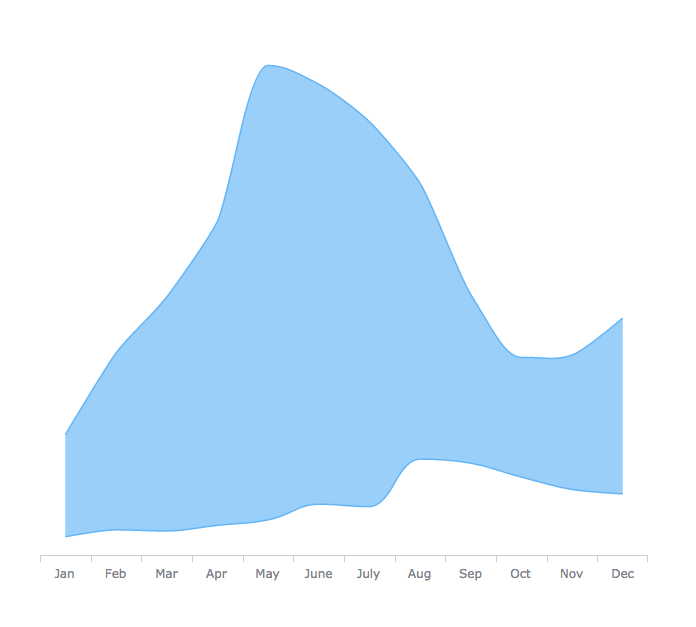
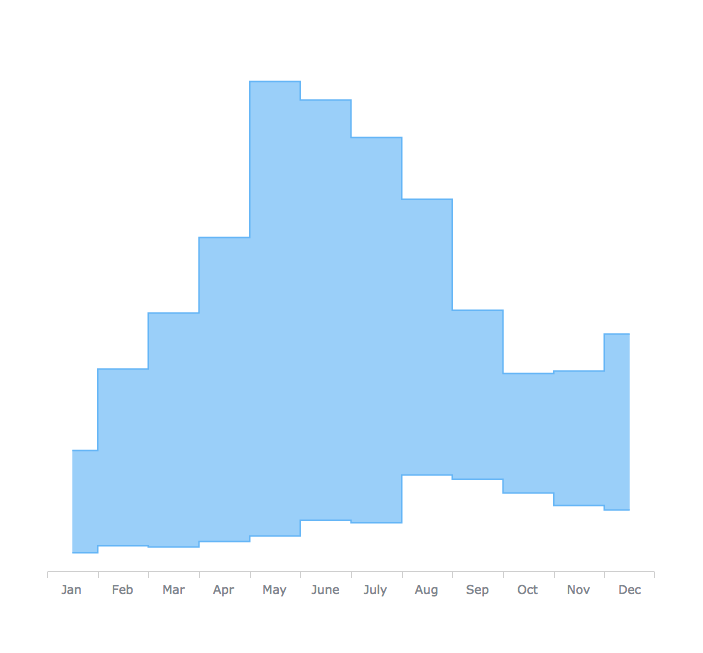
When your data set contains maximums and minimums instead of precise or average values, go for the range charts.
In this way, your visualization will clearly display the largest (highest) and the smallest (lowest) values of
points, which greatly facilitates further comparison-based analysis of the resulting ranges.
