Stock Chart
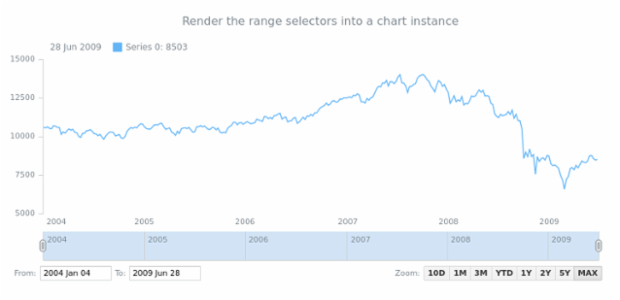
The Stock Chart is a powerful tool for the data visualization and analysis of price movements over time in stock, derivative, currency, bond (credit/debt), commodity, and any other markets.
Stock charts display how variables change over time. It is important to remember that this type of graph supports no other scale than the time scale.
Generally speaking, the graph can be divided into two main parts: the plot and the scroller. One of the most notable peculiarities of the Stock Chart lies in its ability to accommodate a number of various chart types on the same plot. For example, it can be area, line, candlestick, OHLC, range spline, and other graphs.
No matter how many series are displayed, all of them share the only two axes.
The second main part of stock charts, the scroller, consists of a scrollbar, two thumbs for adjusting the zoom, and a generalized thumbnail chart that ensures convenient navigation when the main chart is zoomed in. The scroller is helpful in scaling all graphs on the plot, making it easier to review data within a certain time period.
Similar Charts
Resources
View more samples in our gallery:
Read more information in our documentation:


