Gantt Chart

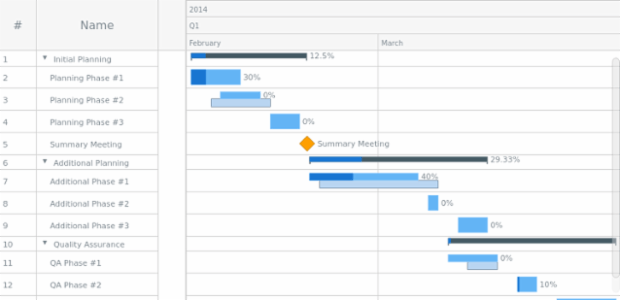
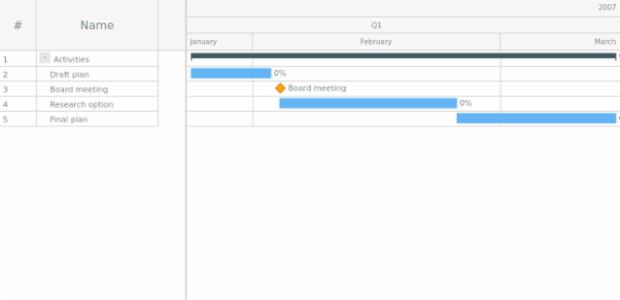
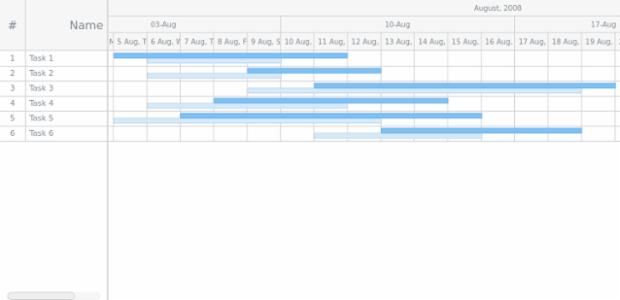
A Gantt Chart is a type of Bar Chart that shows a project schedule. Gantt charts display the start and finish dates of the tasks, summary elements and milestones of a project. All the elements together comprise the work breakdown structure of a project. The Gantt Chart's vertical axis is a task list. It is possible to enrich the diagram with complex tasks, completion rates, indicators of order and dependency, as well as milestones (markers of key events).

Planned-vs-Actual Chart created by anonymous

Planned-vs-Actual Chart

By anonymous, Mar 2
Resource Chart Editing created by anonymous

Resource Chart Editing

By anonymous, Sep 8
Settings From Data created by anonymous

Settings From Data

By anonymous, Feb 6
Start/End Markers created by anonymous

Start/End Markers

By anonymous, Nov 11
Styling Data Grid created by anonymous

Styling Data Grid

By anonymous, Jun 4
Table Data created by anonymous

Table Data

By anonymous, Mar 8
Table Data created by anonymous

Table Data

By anonymous, Jan 9
Sample created by anonymous

Noname sample

By anonymous, Sep 6
Sample created by anonymous

Noname sample

By anonymous, Apr 10
Sample created by anonymous

Noname sample

By anonymous, Apr 15