Gantt Chart

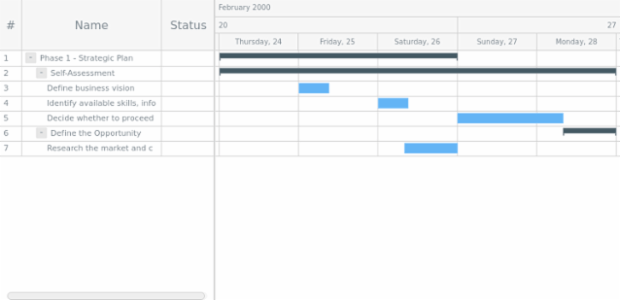
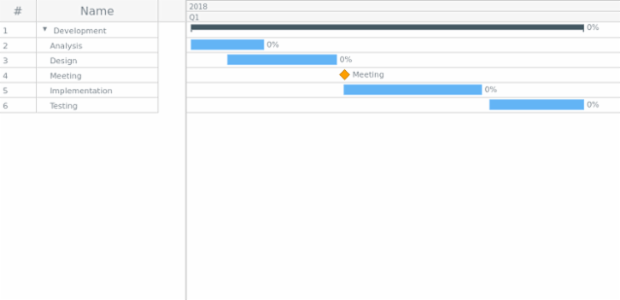
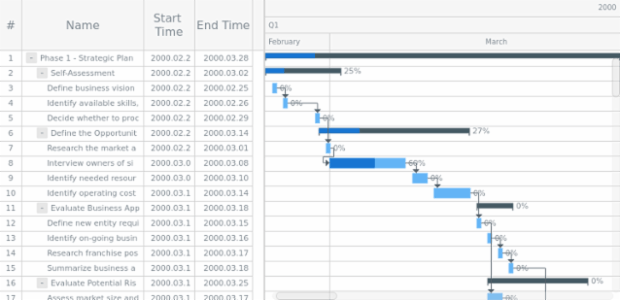
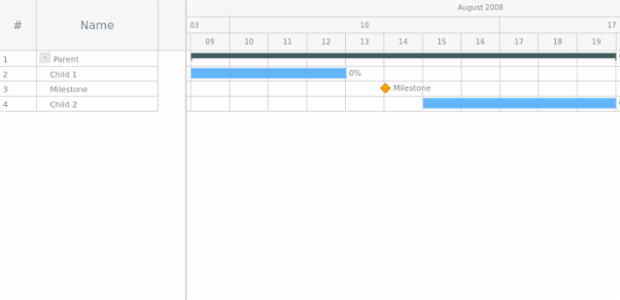
A Gantt Chart is a type of Bar Chart that shows a project schedule. Gantt charts display the start and finish dates of the tasks, summary elements and milestones of a project. All the elements together comprise the work breakdown structure of a project. The Gantt Chart's vertical axis is a task list. It is possible to enrich the diagram with complex tasks, completion rates, indicators of order and dependency, as well as milestones (markers of key events).

anychart.ganttProject created by anonymous

anychart.ganttProject

By anonymous, Dec 17
anychart.ganttProject created by anonymous

anychart.ganttProject

By anonymous, Sep 20
anychart.ui.ganttToolbar created by anonymous

anychart.ui.ganttToolbar

By anonymous, Jul 29
Column Formatting Presets created by anonymous

Column Formatting Presets

By anonymous, Oct 3
Edit Controls Styling created by anonymous

Edit Controls Styling

By anonymous, Dec 5
Editing Events created by anonymous

Editing Events

By anonymous, Mar 19
GANTT Basic Sample created by anonymous

GANTT Basic Sample

By anonymous, Aug 14
GANTT Basic Sample created by anonymous

GANTT Basic Sample

By anonymous, May 29
GANTT Basic Sample created by anonymous

GANTT Basic Sample

By anonymous, Apr 3
GANTT Basic Sample created by anonymous

GANTT Basic Sample

By anonymous, Feb 2
GANTT Basic Sample created by anonymous

GANTT Basic Sample

By anonymous, Jun 25