Line Chart
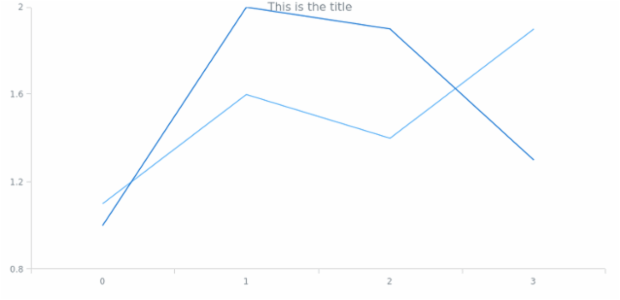
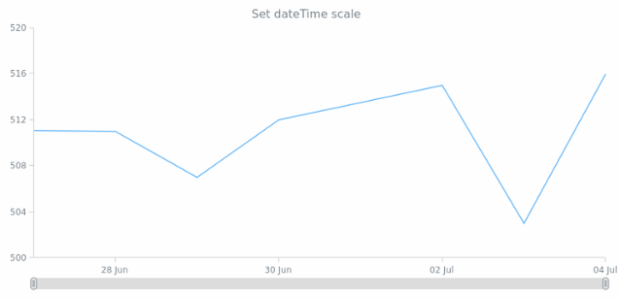
A Line Chart depicts information as a series of markers connected by straight line segments. Mostly it is used to visualize a trend in data over intervals of time – a time series – thus the line is often drawn chronologically. In such cases, they are sometimes referred as run charts.


![Line Chart with custom palette created by anonymous, Line Chart with custom palette chart.palette(['Red', 'Green', 'Blue']); Line Chart with custom palette created by anonymous, Line Chart with custom palette chart.palette(['Red', 'Green', 'Blue']);](https://preview.anychart.com/pg/slvjboie.png)


