Line Chart

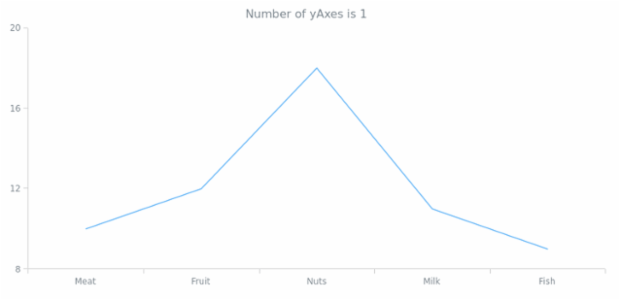
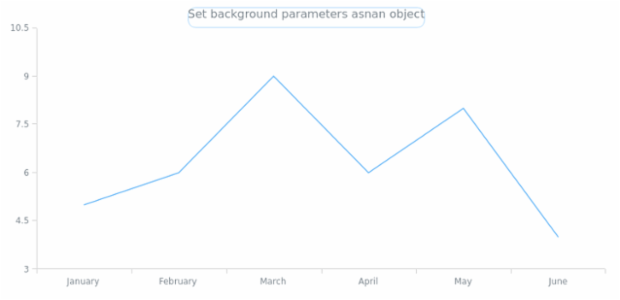
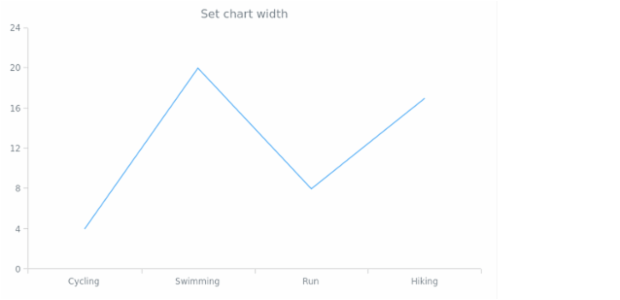
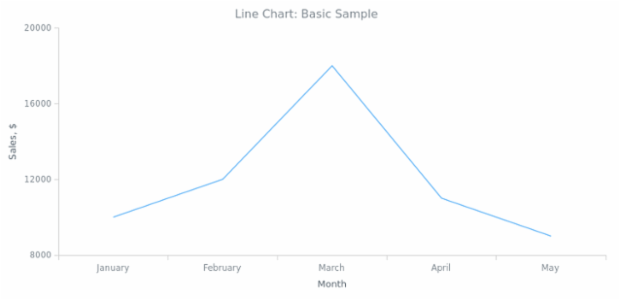
A Line Chart depicts information as a series of markers connected by straight line segments. Mostly it is used to visualize a trend in data over intervals of time – a time series – thus the line is often drawn chronologically. In such cases, they are sometimes referred as run charts.

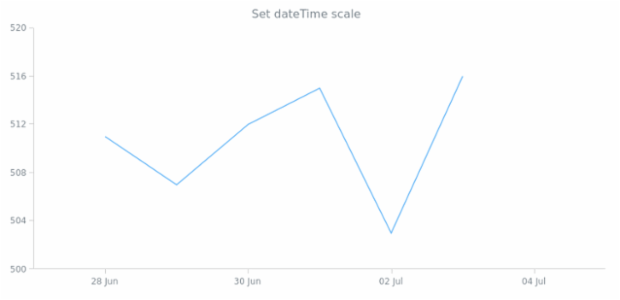
anychart.scales.dateTime created by anonymous

anychart.scales.dateTime

By anonymous, Oct 17
BCT General Settings 01 created by anonymous

BCT General Settings 01

By anonymous, Jan 24
BCT General Settings 01 created by anonymous

BCT General Settings 01

By anonymous, Jan 23
BCT Line Chart 01 created by anonymous

BCT Line Chart 01

By anonymous, Sep 24
BCT Line Chart 01 created by anonymous

BCT Line Chart 01

By anonymous, Sep 25
BCT Line Chart 01 created by anonymous

BCT Line Chart 01

By anonymous, Dec 17
BCT Line Chart 01 created by anonymous

BCT Line Chart 01

By anonymous, Jul 25
BCT Spline Chart created by anonymous

BCT Spline Chart

By anonymous, Oct 12
CS Interactivity 14 created by anonymous

CS Interactivity 14

By anonymous, Jan 19
CS Legend Standalone 01 created by anonymous

CS Legend Standalone 01

By anonymous, Apr 28