Pie Chart
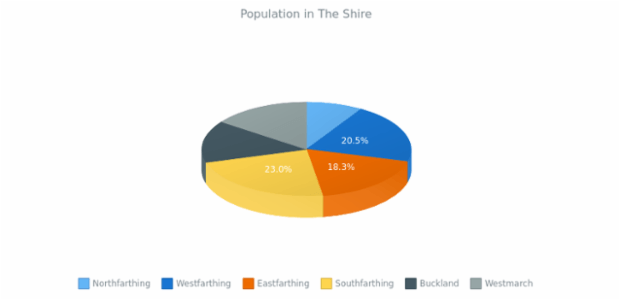
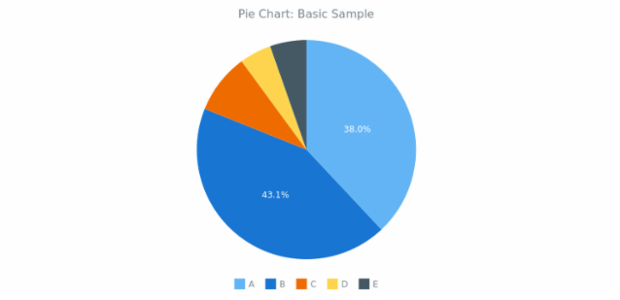
A Pie Chart (rarely named Emma chart (or a circle chart) is a circular graphic which is divided into slices to illustrate numerical proportion. In a Pie Chart, the length of an arc of each slice, (as its central angle and area) is proportional to the value it represents. Sectors can be not only depicted within the whole circle but also separated from the rest of the chart making it an exploded Pie Chart. A Pie Chart with a blank circular area in the center is called a Doughnut Chart. This chart is named for its resemblance to a pie which has been sliced. Pie charts are used for at least two hundred years in the science, business and mass media.


