Pie Chart
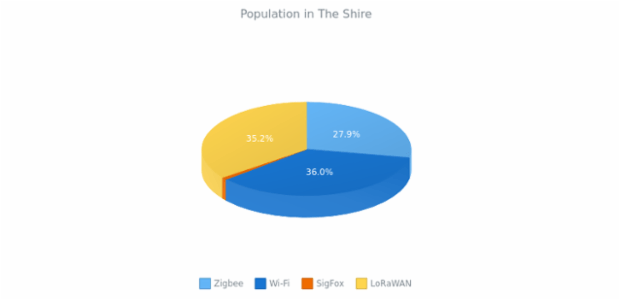
The Pie Chart is essentially a circle divided into sectors.The area of each item reflects its value's proportion of the sum of all values in one data set.
Pie Chart are useful when you need to display the share of each constituent part as compared to the whole volume. Sectors can be not only depicted within the whole circle, but also separated from the rest of the chart making it an exploded Pie Chart. This kind of circular graphic remains illustrative only when provided with a few constituent parts.Pie Chart with too many slices are hard to work with efficiently.
Pie Chart are useful when you need to display the share of each constituent part as compared to the whole volume. Sectors can be not only depicted within the whole circle, but also separated from the rest of the chart making it an exploded Pie Chart. This kind of circular graphic remains illustrative only when provided with a few constituent parts.Pie Chart with too many slices are hard to work with efficiently.
Similar Charts
Resources
View more samples in our gallery:
Read more information in our documentation:


