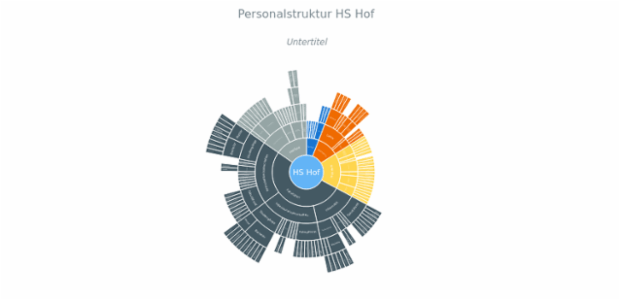
Sunburst Chart
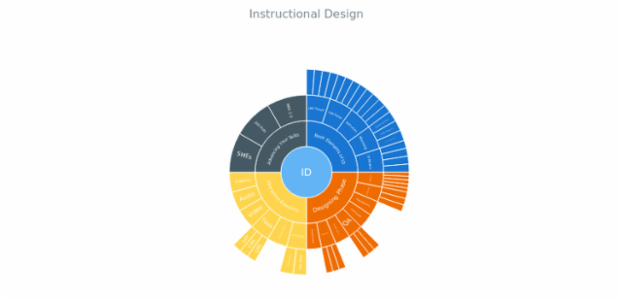
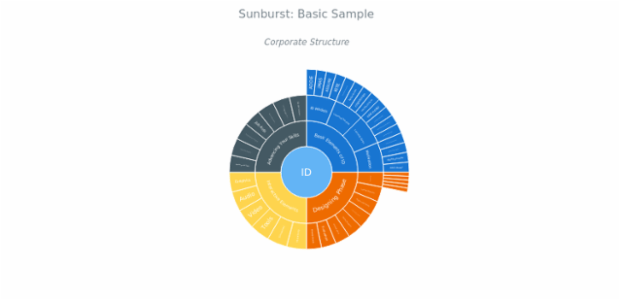
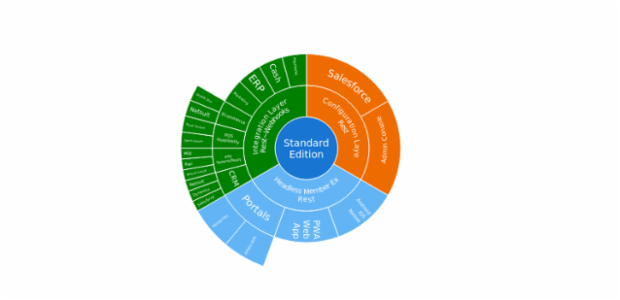
Sunburst chart is also known as a Ring Chart, a Multilevel Pie or a Radial Treemap. It is used to visualize hierarchical data structures.
Sunburst represents an inner circle surrounded by rings of deeper hierarchy levels. The angle of each segment is either proportional to a value or divided equally under its parent node.
All of these segments may be colored depending on which category or hierarchy level they belong to.
It is likely that the Sunburst diagram was developed to accommodate subunits of the pie chart’s primary segments (the earliest known example dates back to 1801, and it can be found in William Playfair's Statistical Breviary).
Similar Charts
Resources
View more samples in our gallery:
Read more information in our documentation:
